ProjectData · Team of 4
Retail Stockout Prediction
Stockout risk + inventory optimization
A 51.86% stockout rate, predicted before it happens — then a budget-bounded restocking plan. I led the EDA and visualization that set the strategy.
Filed underAnalystConsultant
§01Context
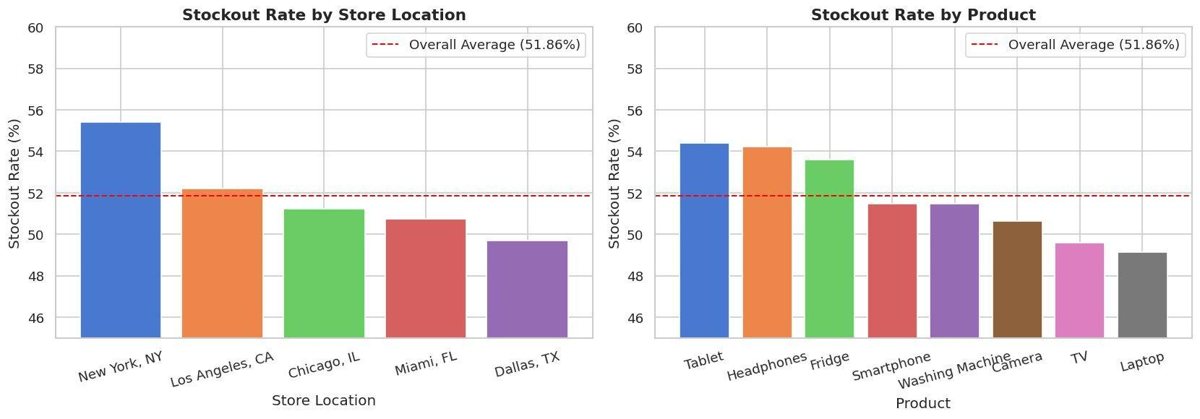
Over half of the transactions in the dataset — 51.86% — ended in a stockout, proving existing replenishment logic couldn't anticipate demand spikes or supply delays. The goal: predict high-risk store-product combinations before they stock out, then allocate a fixed restocking budget against them. A 4-person team project; I was the EDA & Visualization Lead.
§02What I did
- Led the exploratory analysis across 5 stores × 8 products, surfacing the risk patterns that shaped the model — including the counterintuitive ones.
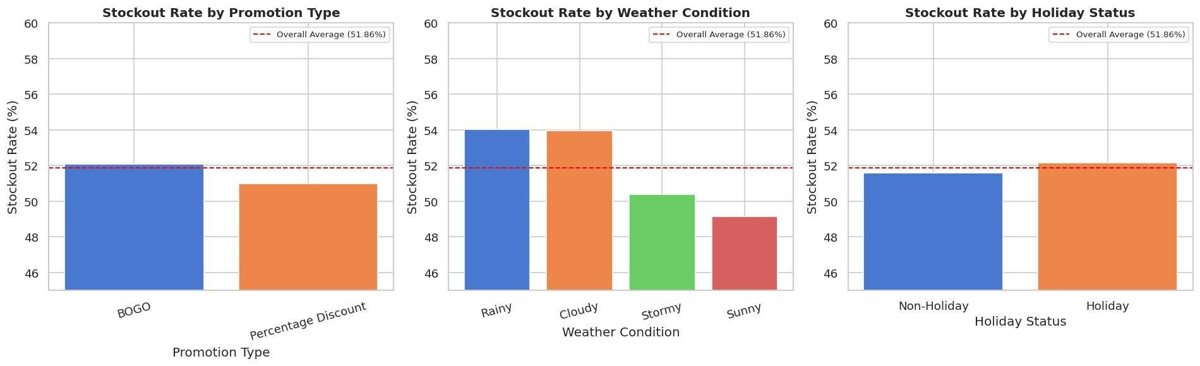
- Found that rainy (54.0%) and cloudy (53.2%) days drive more stockouts than sunny ones (49.1%) as customers move indoors, that Saturday peaks at 54.2% (mid-week replenishment misses weekend traffic), and a 'buffer illusion' — stockout vs non-stockout transactions had nearly identical inventory buffers (151 vs 155), proving simple threshold rules fail.
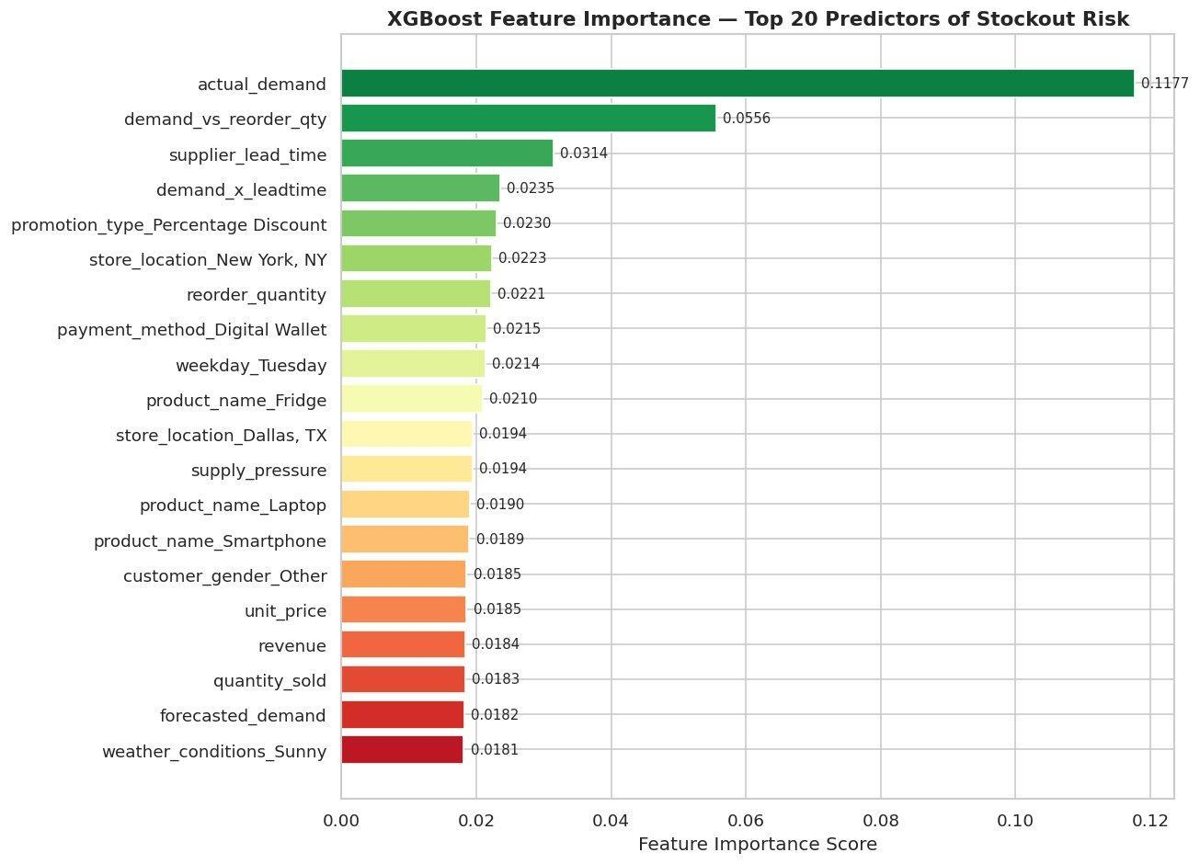
- Built the visualizations and insight summaries that justified tree-based modeling over linear baselines and a reconstructed, operationally-meaningful target.
§03Outcome
- The team's tuned XGBoost hit 0.77 AUC and 76.6% recall — recall-prioritized, because missing a real stockout costs more than an early reorder.
- A Gurobi optimizer allocated 1,685 restocking units across 11 priority stores within a $32,836 budget, turning risk scores into a concrete reorder plan.
- Final recommendation: a Score-Monday → Optimize-Tuesday → Order-Wednesday workflow that converts reactive restocking into predictive inventory management.
§04From the analysis
EDA that didn't just describe the data — it set the strategy.